Managing Data and Files#
Introduction#
Now that you know how to access data at different monitoring locations, we’ll take a look at how data is imported into EnviroData. Specifically, you’ll learn the following in this tutorial:
Summary: Managing Files and Data
Data is imported into EnviroData when EDDs are uploaded to the FTP and the data is ingested.
Monitoring Locations are populated with data after being linked to data sources.
The Imports page provides a searchable list of historical import events.
Each import event has a detailed information page displaying info related to the event.
The Manage > Monitoring Locations page allows you to create new monitoring locations and link them to data sources.
The Raw Data Repository is a searchable and filterable place to store and access files.
The EnviroData Data Pipeline#
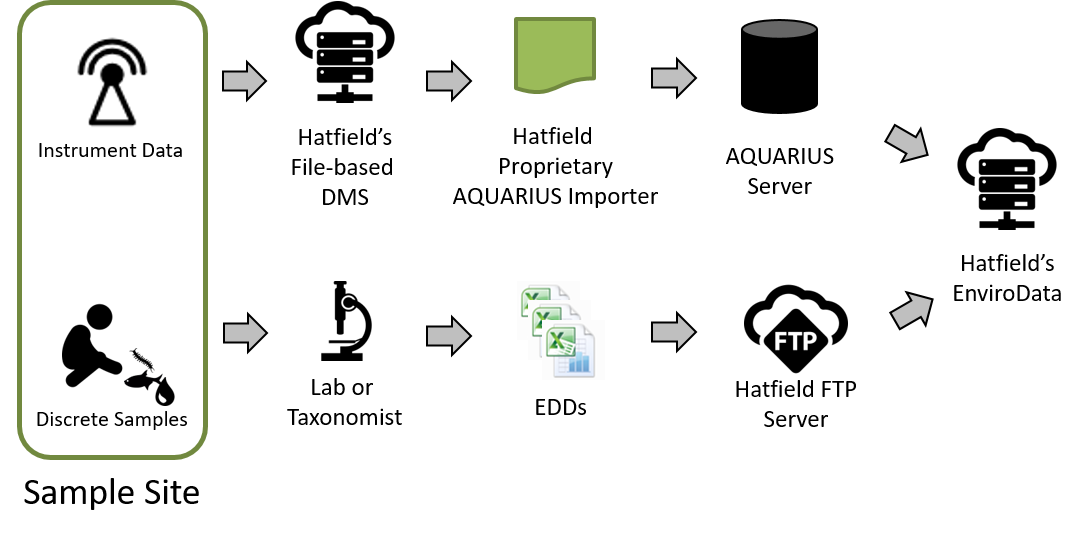
It’s a good idea to become familiar with how your data gets into EnviroData; all the way from sampling location to your computer monitor. The diagram shows gives a simplified overview of this process below for discrete and continuous data:

This tutorial is specifically concerned with the flow of discrete data, so we’ll focus on the lower half of the image above. After your discrete samples have been collected, shipped to the lab and analyzed, the resulting data files (also known as Electronic Data Deliverables, or EDDs) are placed into EnviroData’s FTP server.
EnviroData’s systems then detect this newly uploaded dataset file and work to ingest the raw data into the EnviroData database, where it is then made available to you on the UI. A crucial step in this process is the mapping of data from a specific data source as listed in the EDD file to the correct monitoring station on the EnviroData UI. To do this, EnviroData reads the data source value from the EDD file, then looks up the corresponding monitoring station in the database and saves all data to that station. We’ll go into how to create links between data sources to monitoring locations in the coming sections.
If you’ve ever opened someone else’s Excel file, you’ve surely noticed that data can be formatted in countless ways. After speaking with multiple analytical labs to determine the most commonly used formats and associated metadata, we’ve designed EnviroData to be capable of handling EDDs that adhere to the A125 format. Data in any other format uploaded to EnviroData’s FTP server is automatically labeled as type Generic. We’ll go over what EnviroData does with Generic EDDs that it’s not capable of ingesting later on in this tutorial. For now, we’ll step through what to expect in the ideal scenario where a valid A125 format EDD is uploaded.
See also
For more information on electronic data deliverables, the A125 format, and general tips for structuring datasets, see our post on EDDs and Data Formats.
Import Events#
The entire act of uploading an A125 EDD file to EnviroData’s FTP server followed by the ingestion of data to the database is defined as an import event. All import events are listed on the Imports page. Navigate there now by clicking Imports on the left sidepanel. The image below gives a brief overview of what you’ll see on the Imports page.
The Imports page contains a list of files that have been successfully uploaded and ingested into the EnviroData database (1). In addition, it shows the upload date (2) and COC code (3) for each file. Copy and paste the following COC code into the Search bar (4): C7530786.
You should see only one import event with this COC code. Go ahead and click the View Details button in the Actions column for this file (5).
Imported Data Details#
The Imported Data page for an import event includes information related to a specific data import event. Some basic information is first listed at the top of the page (6), including:
Import Date
COC code
Source file
The green ADD DOCUMENT button allows you to link to any important documents which may be relevant to this dataset.
You’ll see a spreadsheet at the bottom of the page (7) which lists all of the data points that were ingested into the database during this import event.
See also
Import Notifications. You can be notified when new data has been imported into EnviroData, or when guideline standards are exceeded using the Manage Discrete Import Notifications page. For more info, see the import notifications recipe in the EnviroData Cookbook.
The middle of the Imported Data page contains three cards labeled Stations (8), Analytes (9), and Mediatypes (10). These only show the items that were detected as new items upon ingestion into the database. For instance, you’ll notice that the Stations card has 1 item labeled Lower Upper Flathill, indicating that EnviroData detected it as a new location (or more specifically, data source). Looking at the Data panel on the bottom of the page, you’ll note there are also data points for the SW9 Station. Since EnviroData already has this data source in the database, it’s not listed in the Stations card as a new data source.
As discussed above, EnviroData takes the data source value for a given datapoint, determines which monitoring station that data source is linked to, and then saves the data to the corresponding monitoring station*. For instance, you can view the newly added data for the SW9 by navigating to the SW9 Discrete Sample Station as outlined in Tutorial 1.
Warning
If you find you need to make revisions to an imported EDD file, either use the metadata tools available within EnviroData or roll the EDD back, make your adjustments, and then re-import the corrected EDD file. Failure to rollback an EDD file back when importing a second version will cause unwanted duplicates in your dataset.
But what about the new Lower Upper Flathill location? You’ll note that EnviroData has detected it as a new Data Source, but there’s no Lower Upper Flathill monitoring location on the left panel, nor does it show up if you search for it in the station search bar on the top panel. The reason for this is because while EnviroData has detected it as a new data source, there is still no corresponding monitoring location to which to assign the data. We will have to create this new monitoring location and link it to the data source ourselves
Monitoring Locations#
To summarize where we are so far: an A125 EDD has been uploaded to the FTP server and the raw data within ingested by EnviroData. During ingestion, EnviroData detected a new data source named Lower Upper Flathill. We’ll now link this new data source to a monitoring location so that we can view the data.
To do this, click Manage button on the left sidepanel and then click Monitoring Locations from the resulting dropdown menu. You’ll see a page similar to the one in the image below.
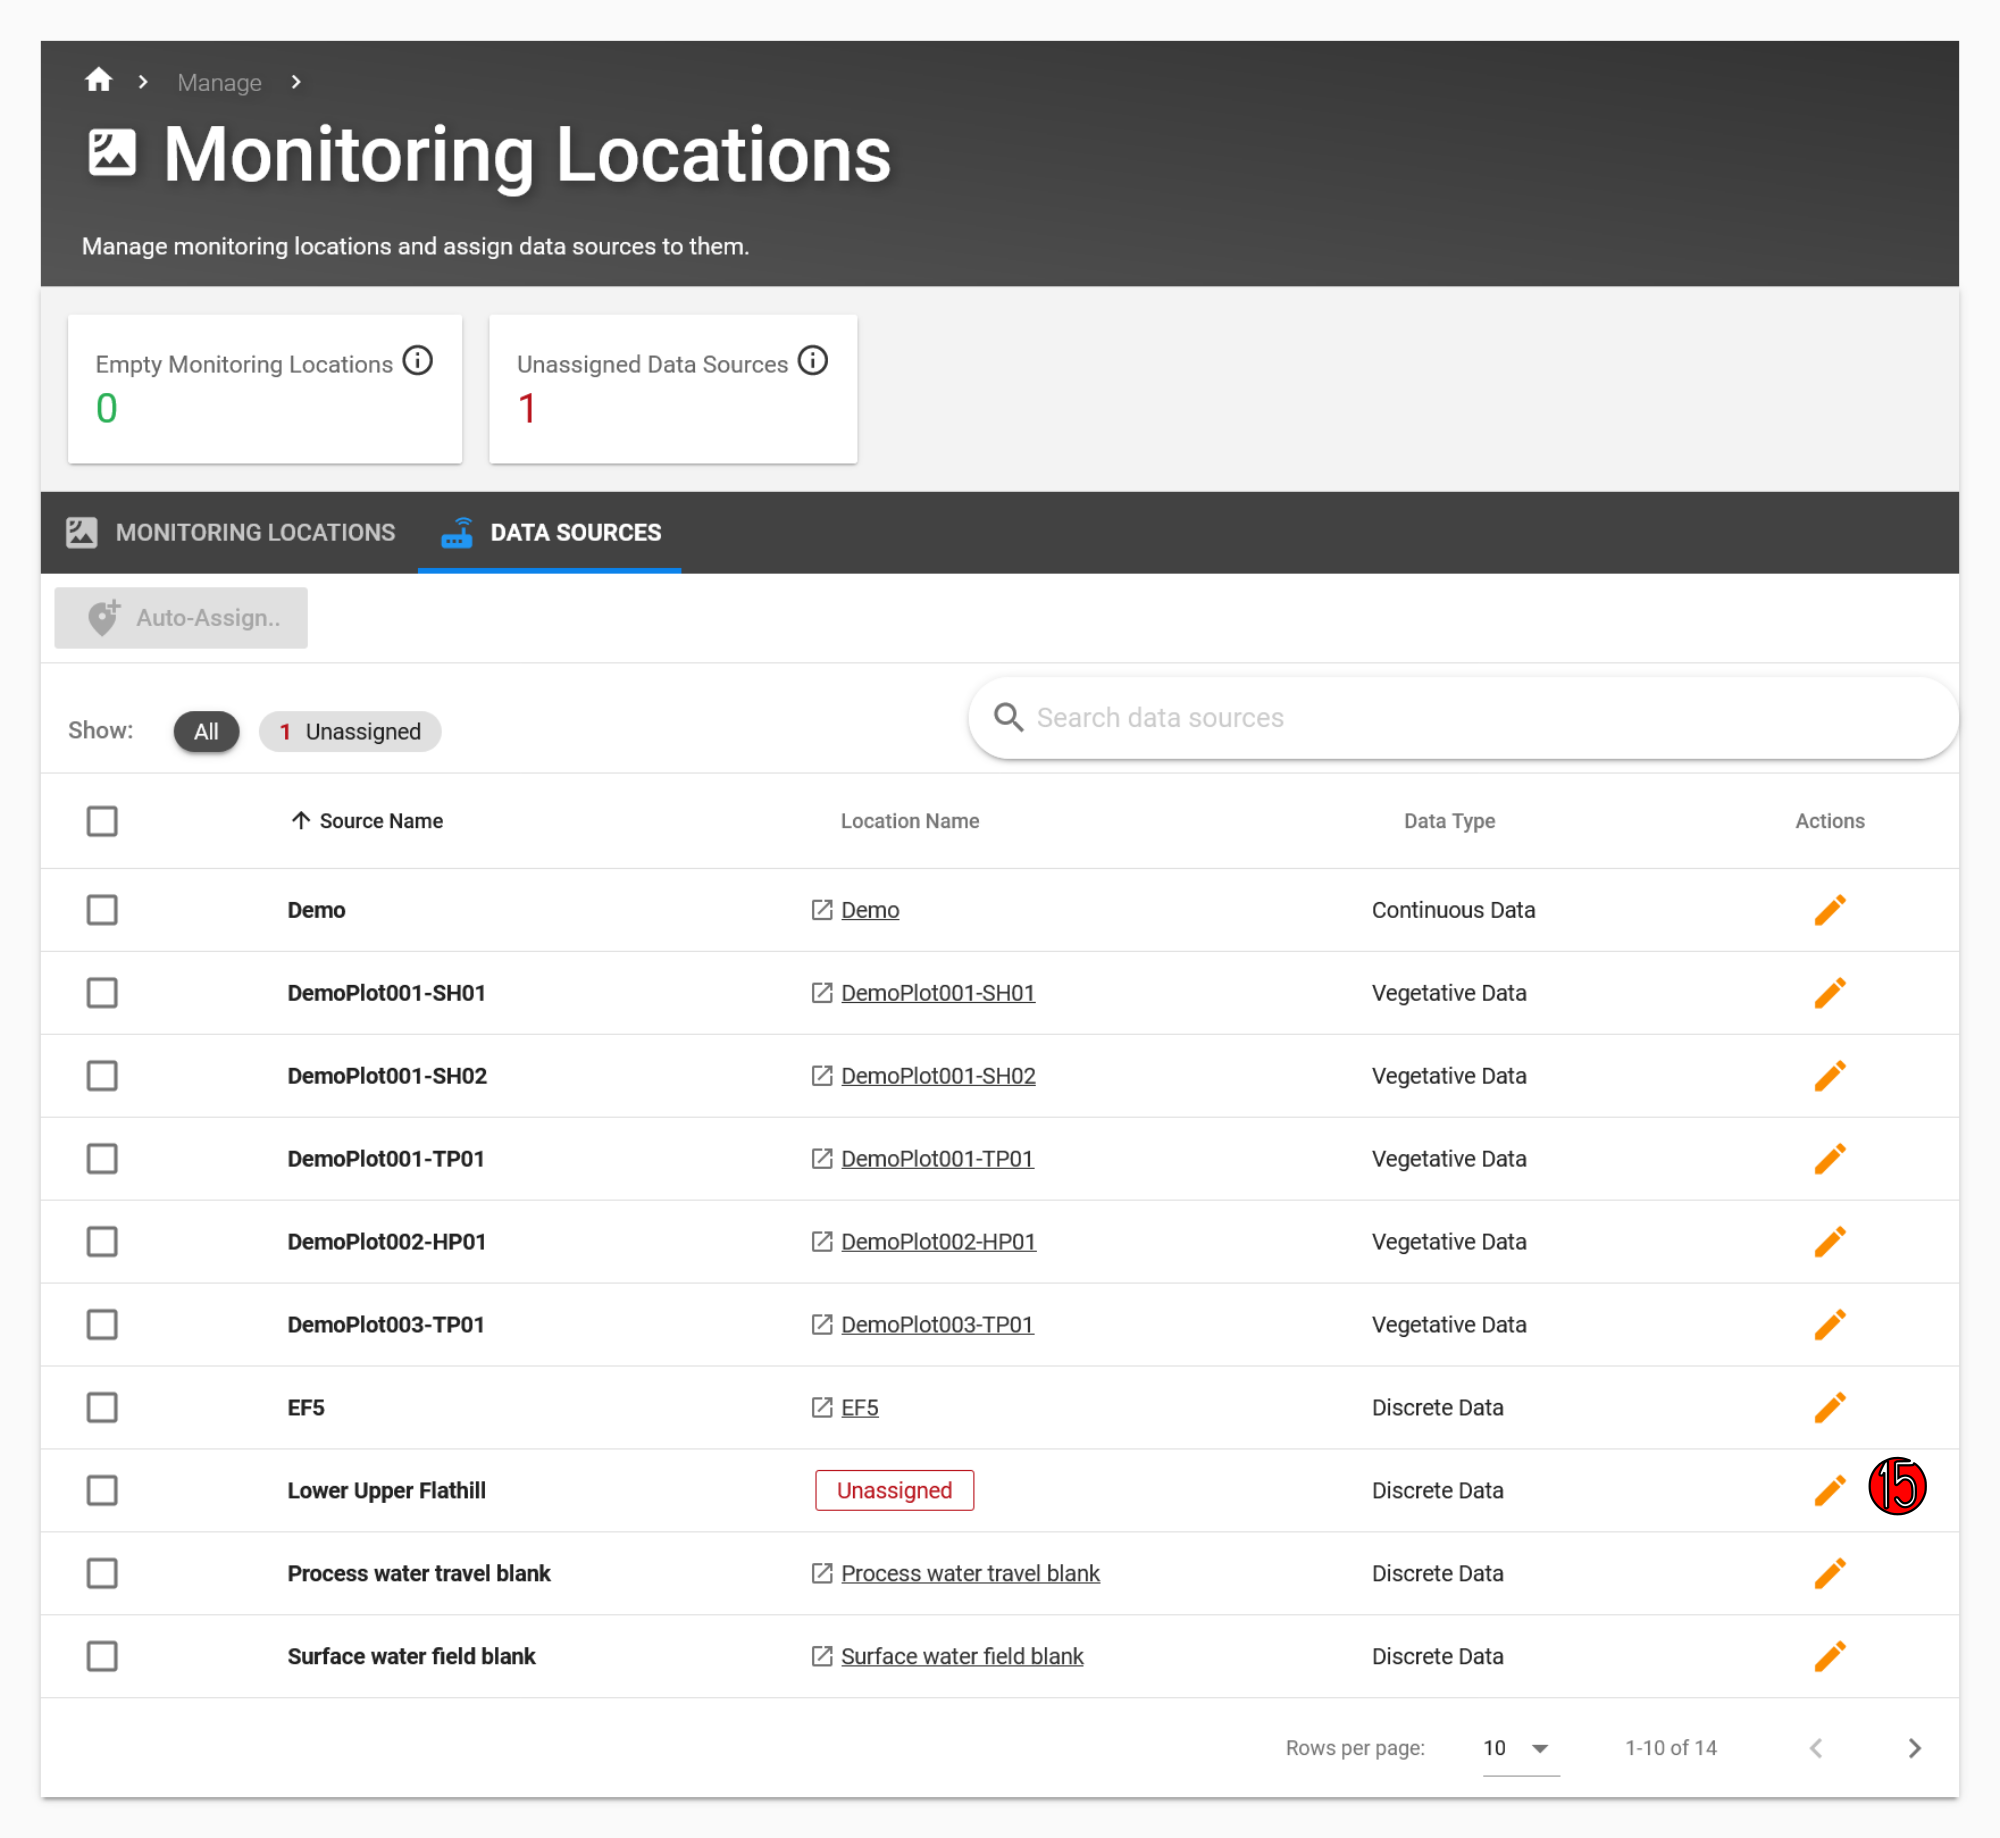
The Monitoring Locations page allows you to view which monitoring locations each data source is linked to and to edit or create new linkages between the two. The Unassigned Data Sources card (11) at the top of the page shows that there is 1 unassigned data source. This is our new Lower Upper Flathill location. We’ll create a new monitoring location with the same name and then link it to this data source.
Click the green Create New Monitoring Location button (12) and give it a location name of Upper Lower Flathill. Then press save.
After you’ve created the new monitoring location, the Empty Monitoring Locations card at the top of the page (13) will update to show “1 Empty Monitoring Location.” Either click the Unassigned Data Sources card next to it or click the Data Sources tab (14). This will bring you to the Data Sources tab (see image below).

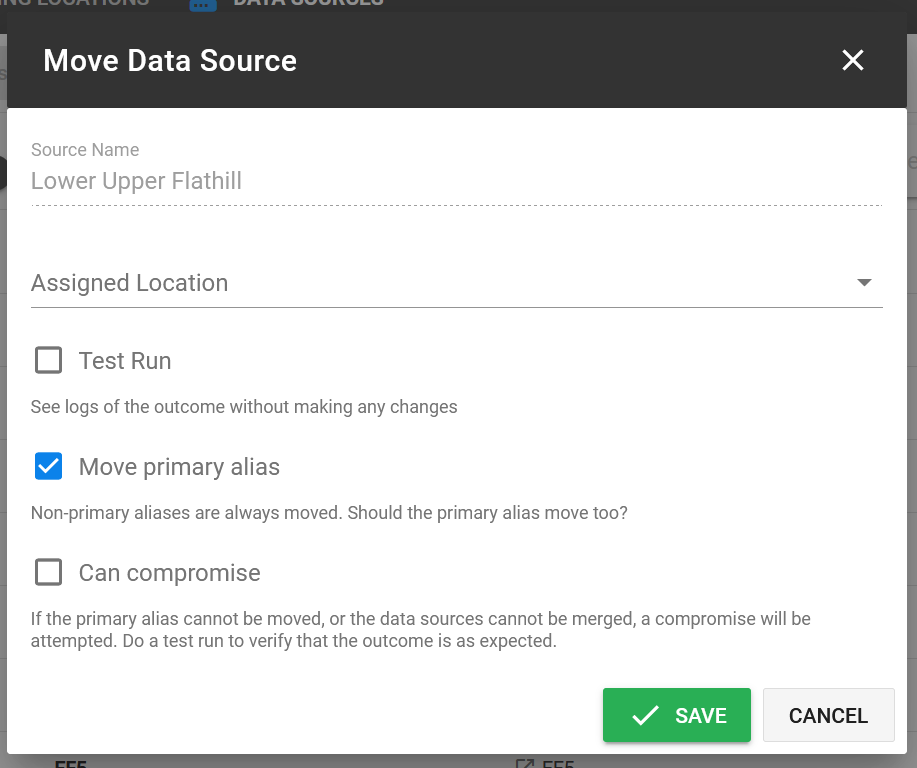
This panel shows all the data sources that EnviroData has detected and the monitoring locations they are linked to. It also shows whether they are discrete or continuous data types, or both. You’ll see Lower Upper Flathill has an UNASSIGNED icon under the Location Name field. Click the pencil icon at the end of the row (15). On the resulting Move Data Source popup modal, click the Assigned Location dropdown menu and select your newly created station. Uncheck Test Run to ensure this actually makes changes. Finally, click SAVE to complete the linkage.
Warning
If you give your station name a different name than the one listed as the data source, EnviroData will create an alias.

Tip
Test Runs. If you want to see what will happen when linking a new station before actually carrying out the action, use the Test Run option. It will show you logs of the ouctome without making any changes.
Now go back to the Monitoring Locations tab. Ensure the Empty tag is not active by clicking All. You’ll now see that the Upper Lower Flathill location has “Upper Lower Flathill” as a linked data source. Click the “Upper Lower Flathill” link under the Location Name column. This will take you to the Station Summary page that you learned about in the first tutorial.
Monitoring Location Categories#
If you look at the left sidebar, you may have trouble finding this newly created station. That’s because its category is still “Unknown” and is thus under the Unknown tab. Click the orange Edit Location* button, then on the Information card, click the pencil icon in the Station Category row. Select Drinking Water and then Save.
Now when you refresh the EnviroData page, you will see your new station under Discrete Sample Stations > Drinking Water > Water on the sidebar.
See also
Aliases. If a monitoring location is linked to multiple data sources, they will be listed as aliases. The primary alias is the name that will be given to the monitoring location in reports. For more on aliases, see the information page on alises.
Files#
The Files page provides a user interface that allows users to upload, query, and download files. You can access it by clicking the File link on the left sidebar.
You’ll be presented with a page allowing you to browse files based on their category. For now, click Browse All. You’ll be presented with a list of files. You can change the number of files shown at a time by changing the Rows per page parameter at the bottom of the table. You can also search for files based on filters, including component, location, date created, and associated metadata.
With an upcoming update to EnviroData, there will be a special workflow EDD files that EnviroData is unable to ingest. EnviroData will label these files as Generic format. Since it is unable to parse through the raw data, it will instead place the files on the Files page.
Tip
The Files page can be used to store important documents, pdfs, and images related to your work. The built-in search system makes it easy to keep these files organized and easily accessible.
Conclusion#
This was an information-dense tutorial, but you now know the most important aspects of how data gets into EnviroData. In the next tutorial we’ll discover tools for making advanced queries for accessing your data.