Data Reports and the Discrete Data Query Tool#
Introduction#
So far we’ve learned how to ingest and access data. While monitoring locations offer you the ability to download datasets individually, the Discrete Data Query (DDQ) tool takes data access a step further by allowing you to download datasets across multiple stations, analytes, and media types.
Summary: Data Reports and the Discrete Data Query Tool
The discrete data query tool allows you to perform customized queries for data.
Data across multiple stations can be downloaded in one search.
Alternatively, an analyte can be selected and data from all locations with that analyte type can be downloaded.
Guidelines can be selected and downloaded with queried datasets.
The Report Options tab allows you to set the output report format, grouping of data worksheets, and whether to include QA/QC data, statistical summaries, and internal EnviroData analyte names.
Complex queries can be saved and shared with other users.
Highly customized reports are available with EnviroData. Speak with a Hatfield Consultant for more information.
Using the Discrete Data Query Tool#
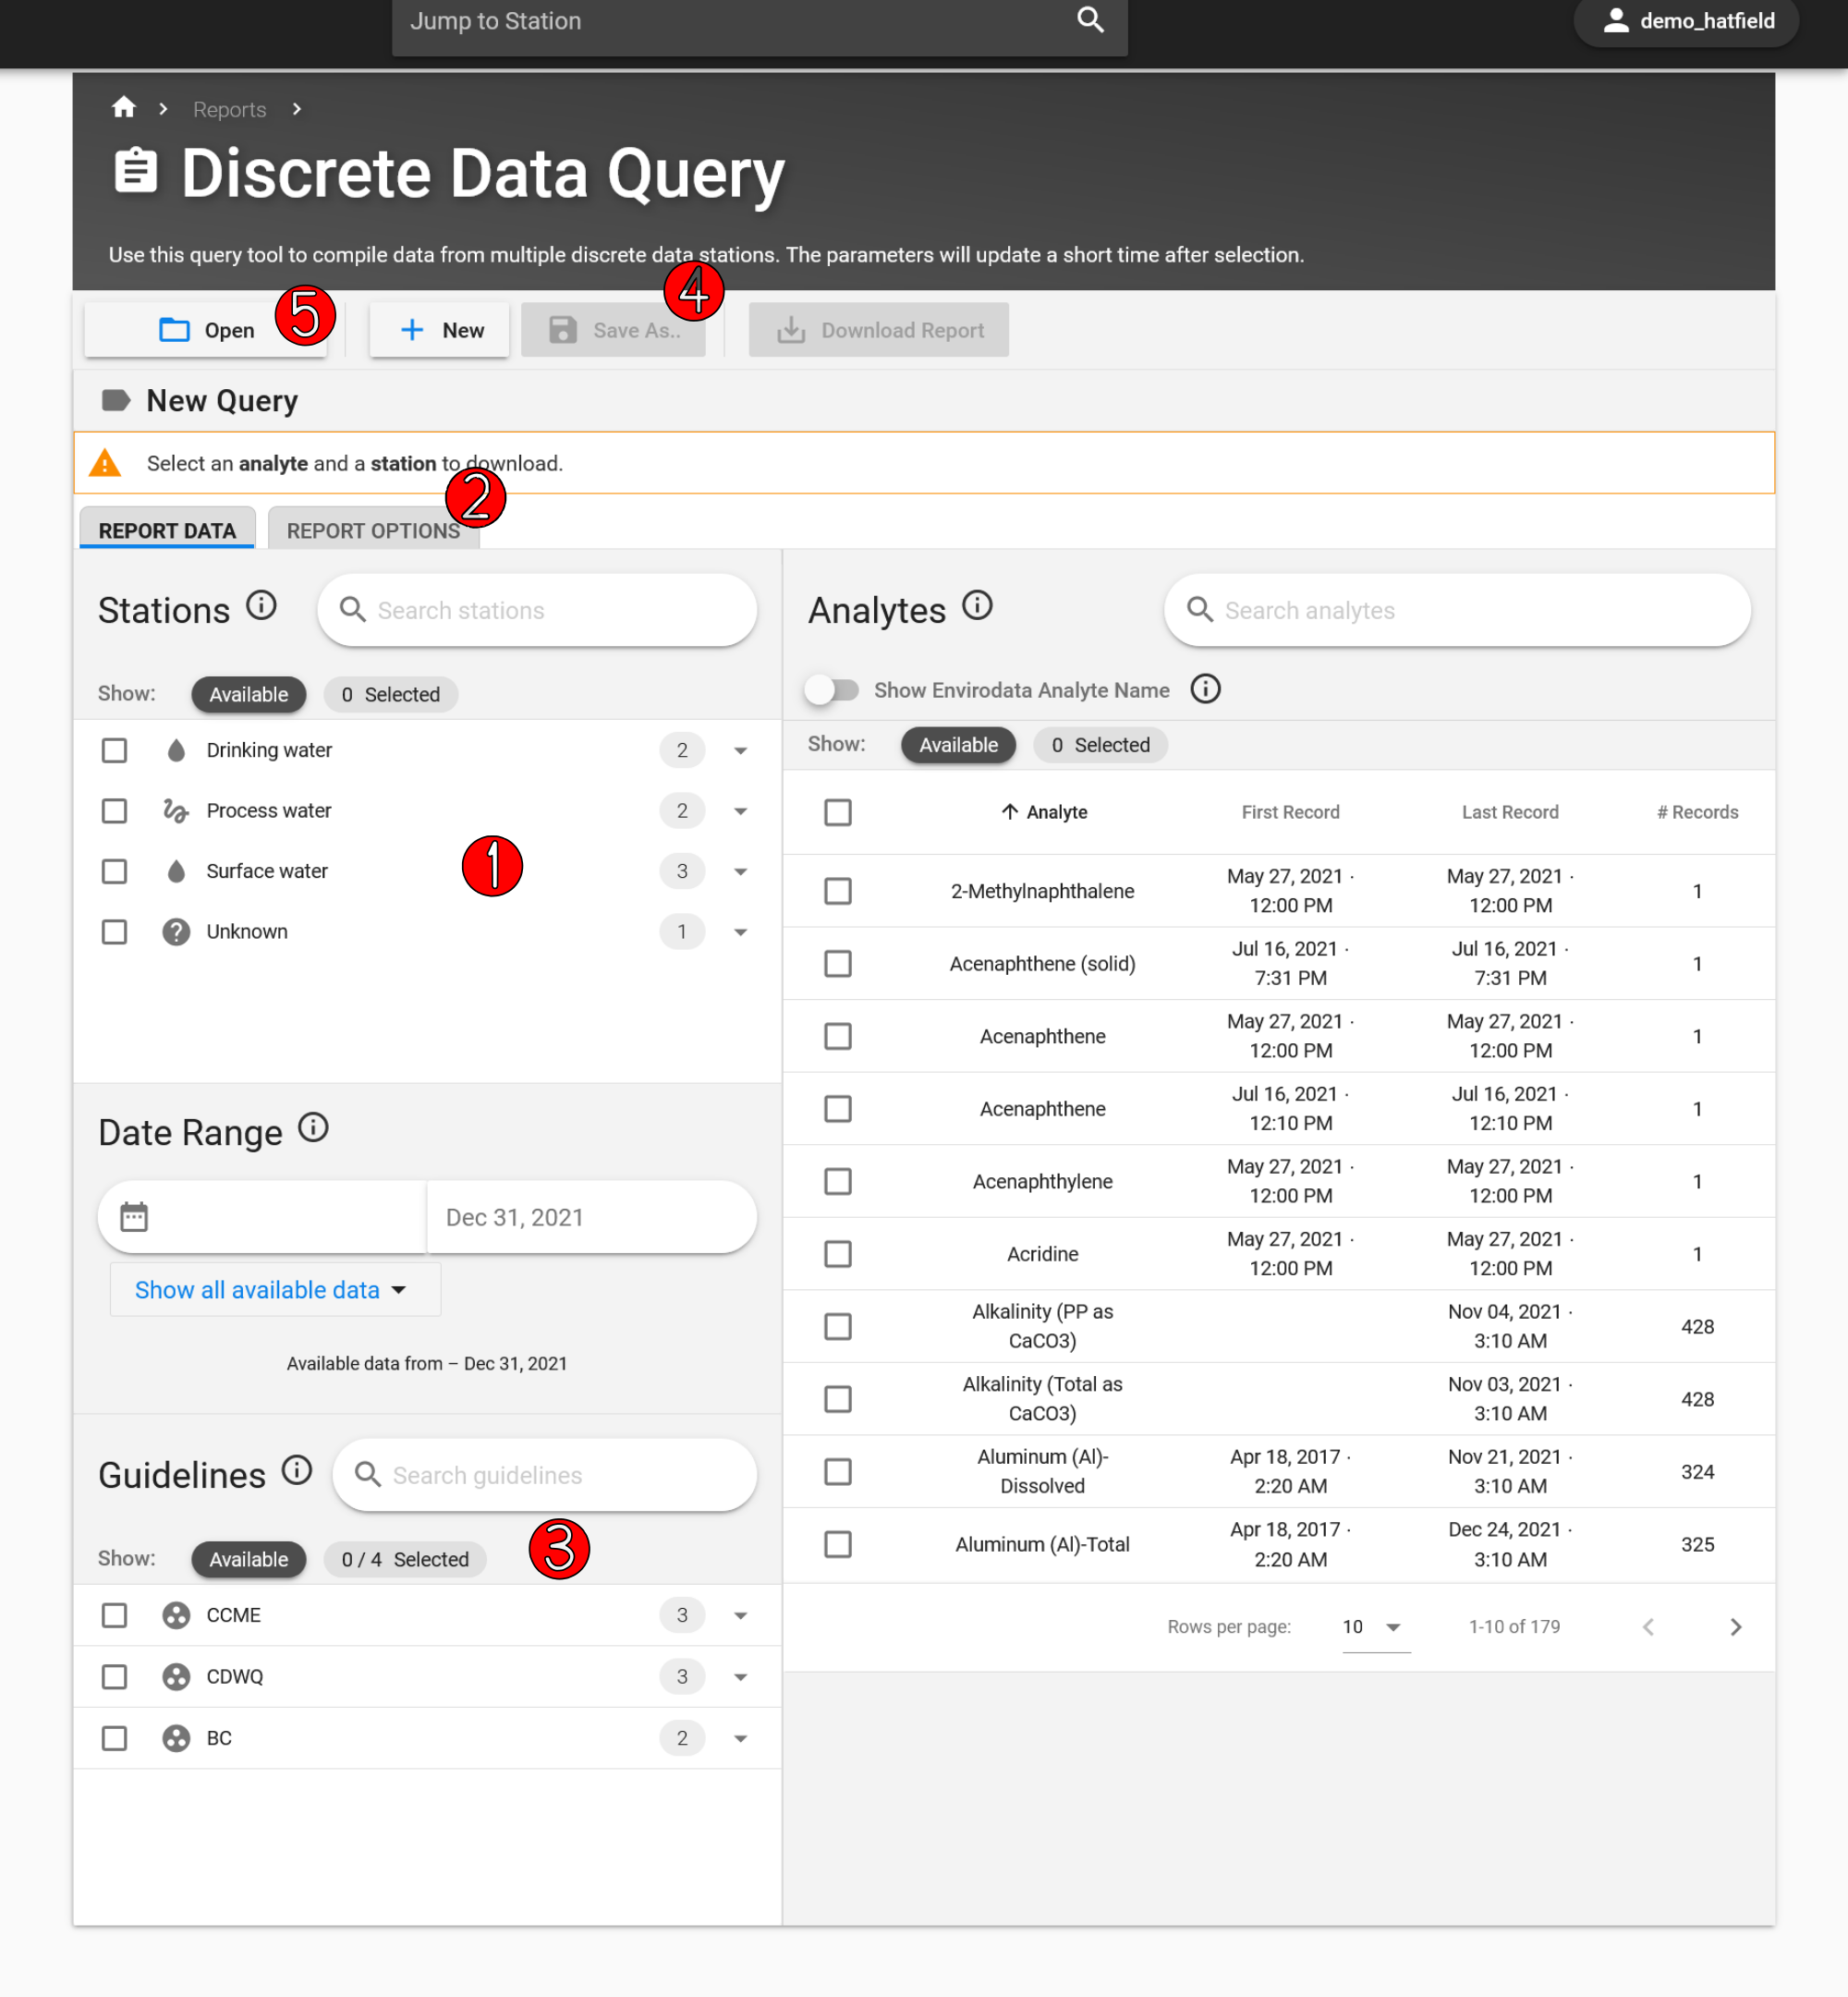
As mentioned in the introduction, EnviroData’s DDQ tool allows users to select a custom list of analytes and stations to produce a downloadable Excel report. We’ll go through the two most common scenarios in which you may find the DDQ useful. To get started, navigate to the DDQ by clicking Reports on the left side-panel and selecting Discrete Data Query from the dropdown menu.

Scenario 1: downloading data from multiple stations#
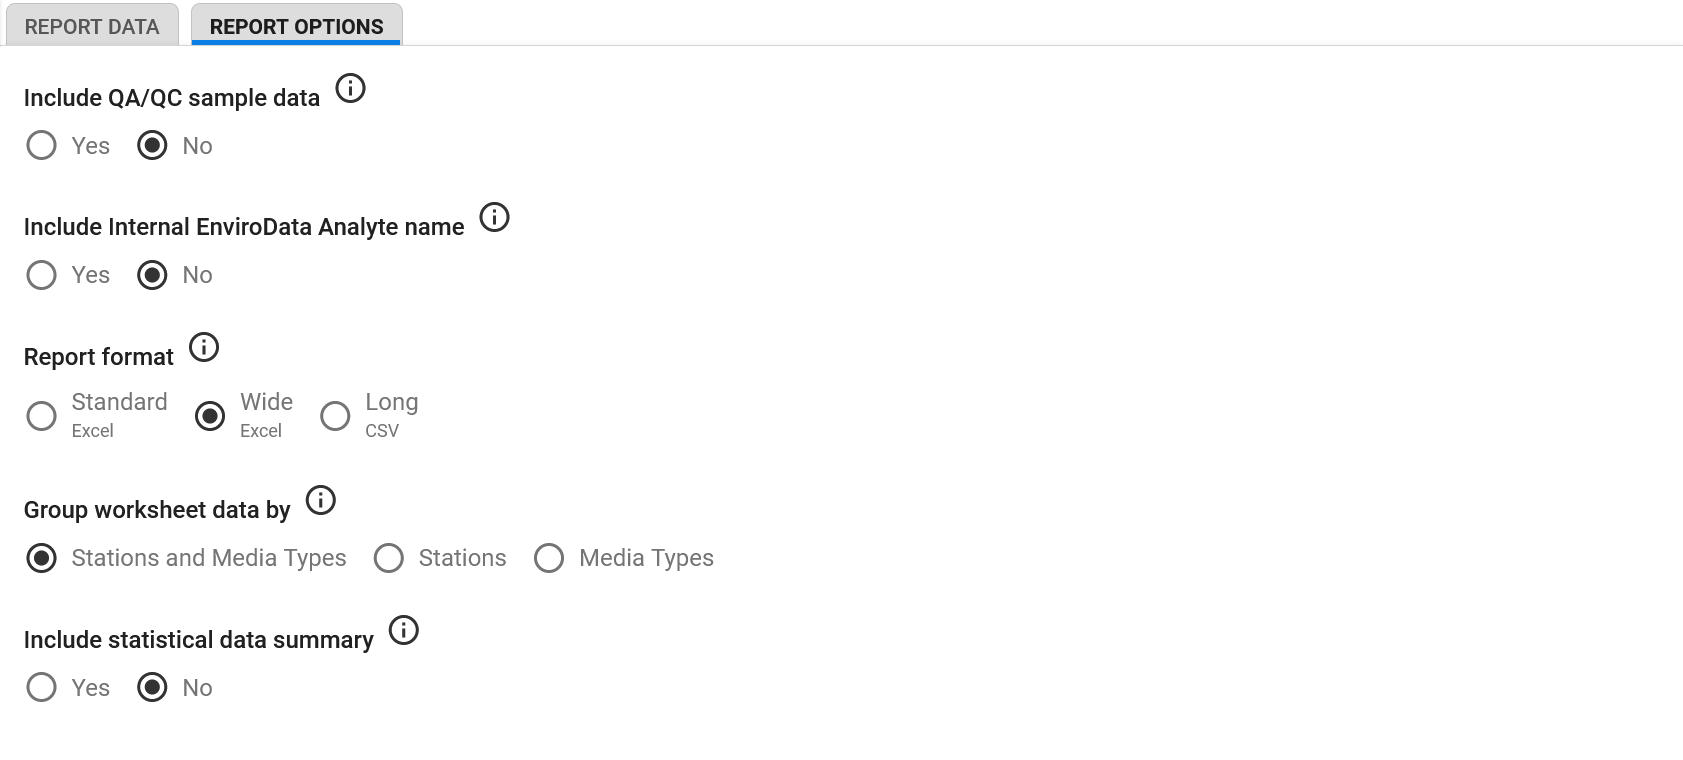
From the DDQ page, use the Stations card (1) to select SW7, SW8, and SW9. SW8 and SW9 are listed under the Drinking Water category, while SW7 has data for both Surface Water and Sediment. We’d like to have the resulting Excel file group all of our data such that all water data is in one tab and all sediment data is in a separate tab. To do this, click the Report Options tab (2) and under the Group worksheet data by row, select Media Types.

Tip
Use the Report Options tab to group your data. This includes downloading QA/QC ata, changing grouping of worksheet ata, including statistical summaries, and changing the report format between Standard Wide and Long. Grouping of worksheet data is especially useful. Imagine you download from multiple stations that produce data from climate and water quality variables. Selecting by stations and media types means there will be a seperate tab for each station’s media types. Selecting stations will group all data for an individual station together. Selecting Media Types means all water quality data from all stations will be grouped into one sheet.
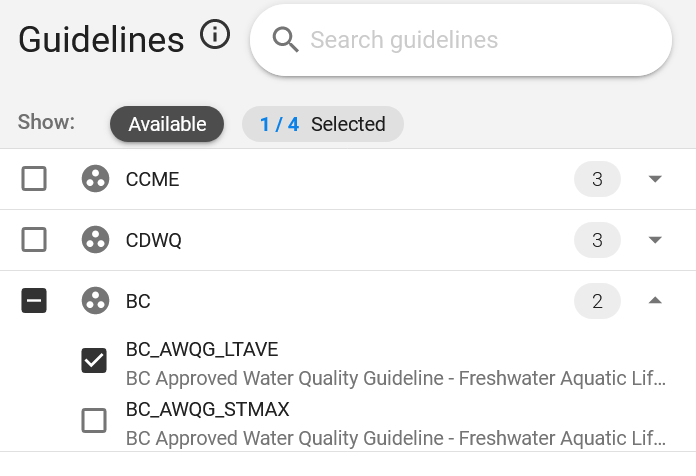
We’ll also add some Guidelines to our report for comparison. Navigate back to the Report Data tab, and in the Guidelines card (3) click the little arrow next to BC, and then select BC_AWQG_LTAVE from the dropdown menu. Don’t worry if you don’t know what this acronym means. We’ll talk more about guidelines in the next tutorial.

After clicking Download Report, take a moment to look over the excel file.
Scenario 2: downloading data from multiple stations based on a common analyte#
Next, we’ll consider a scenario where you’d like to compare specific analytes across multiple stations. Use the Analytes card to search and select Ammonia (N) - Total, Bismuth (Bi)-Dissolved, and Iron (Fe)-Dissolved. Doing so will automatically update the Stations card such that it will only show monitoring locations that have measurements of at least one of the selected analytes.
On the stations card, under Process Water select EF5. Then under Drinking Water select SW9. You can select a range of dates using the Date Range card. For now we’ll stick with “All available data.”
Now click Report Options and this time choose to include QA/QC sample data and a statistical summary. Finally, group the data by stations so that each tab lists the data for an individual station.
Once everything looks good, click Download Report. It may take a few minutes to access and download the resulting report.
See also
See more about data format types in the Information article about data formats.
Saving and Loading Queries#
Imagine you have a specific report that you need to download every week. The DDQ tool has an option for saving queries so that you or another user in your tenant can simply load ther query and download the report.
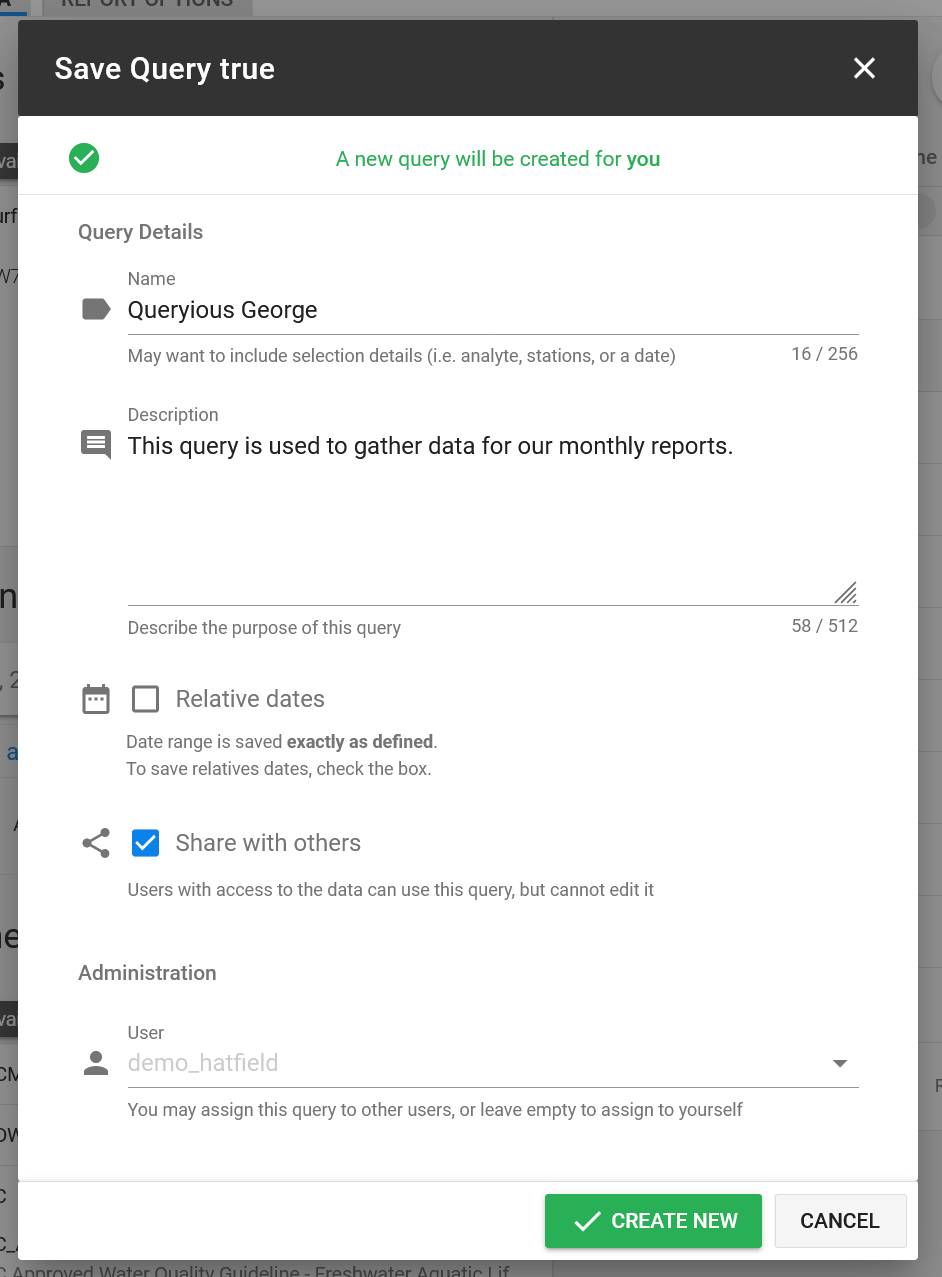
Save your qeuery now by clicking Save As button (4). Give it a name and check “Share with others” so that other users at your company can use this query.

To load a query, hit the Open button (5). This will open a side panel where you can select from the list of saved queries.

Warning
Be careful not to overwrite loaded queries (unless you want to). When saving a query, you’ll see an alert letting you know if you’re updating an existing query. To create a new query rather than overwriting an existing one, simply change its name on the Save Query popup modal.
Other Reports#
With EnviroData, you also have the ability to generate custom reports based on your specific needs. Speak with a Hatfield consultant for more information.